In the life sciences, a mechanistic model is one in which the data are explained by a deterministic set of equations that relate to biological processes. The mechanistic model that we use and study the most is a tumor pharmacokinetic model based on Krogh cylinder geometry. Model equations are shown in Figure 1.
Figure 1

Mechanistic modeling equations for estimation of antigen concentration [Ag], as well as free [C], bound [B]and internalized [I] antibody concentrations.
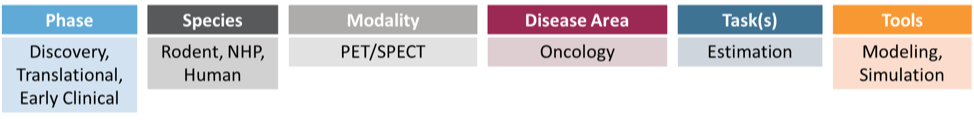
In this simulation study, several TACs were generated for 89Zr-labeled Trastuzumab, a monoclonal antibody that targets HER2 and is used in the treatment of several breast cancers. Known parameters such as antibody molecular weight and blood pharmacokinetics were identified from the literature. These parameters were used in combination with varying levels of tumor HER2 expression (0, 0.5, 5, and 50 nM) and tumor vascularity (50, 100, 200 um capillary-to-capillary distance) to generate time-activity curves for a typical 89-Zr imaging study. The full set of parameters used in this simulation are shown in Figure 2.
Figure 2
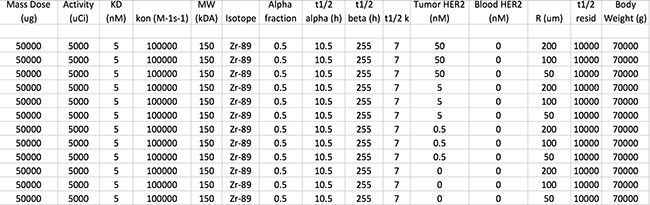
The complete set of parameters were passed to an in-house Matlab-based modeling and simulation engine. This tool was used to execute the model, generate output plots and spreadsheets, upload those spreadsheets via an API to the iPACS, generate public links to each spreadsheet and embed all output into a summary PDF. An example page from this automatically-generated summary report is shown in Figure 3.
Figure 3
These mechanistic modeling tools have tremendous utility both for prediction / simulation tasks (e.g., to evaluate possible parameter regimes as shown here) and in estimation tasks (e.g., to estimate tumor expression from a measured TAC). This model is currently being applied in both preclinical and early-phase clinical studies.