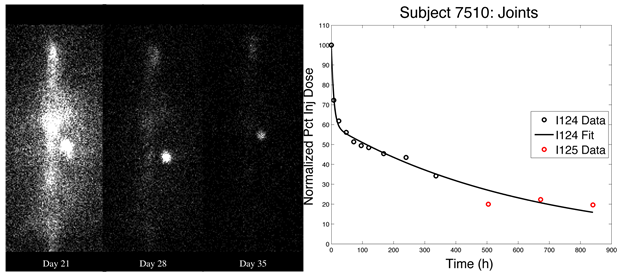
This combined in vivo / ex vivo study of canine pancarpal arthrodesis utilized advanced imaging to achieve the same endpoints with 10 canines as a previous ex vivo only study using 50 canines. During a bone fusion surgery, a putty containing a protein radiolabeled with both 124I and 125I was applied to joints with two doses administered (N = 5 subjects per group). PET imaging was performed at multiple time points out to two weeks until the 124I had decayed. Example PET/CT data are shown in Figure 1.
Figure 1
Beginning at 3 weeks, planar scintigraphy acquisitions were performed weekly out to 5 weeks. Using custom analysis methods to account for scatter from the remaining 124I and to enable calibration and quantitation of the 125I planar scintigraphy data, percent injected dose estimates could be combined across modality to produce curves for each subject for the entire 5-week in vivo imaging period (Figure 2).
Figure 2
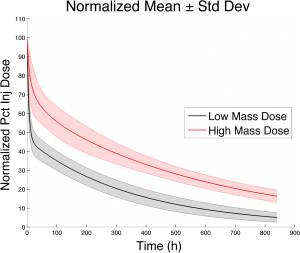
Pharmacokinetic parameters, including mean residence time, were computed for each subject and used to perform statistical analysis between groups (Figure 3).
Figure 3
Upon completion of in vivo imaging, 3D cryo-imaging quantitative autoradiography (CIQA) was performed on each paw. This technique was used to produce high-resolution/high-sensitivity 3D whitelight and 125I autoradiography images. When viewed and analyzed with Invicro’s custom 3D RGB viewer in the VivoQuant®, the CIQA data provided complementary, high-resolution spatial and quantitative information on putty distribution (Figure 4).
Figure 4