
The prevalence of chronic kidney disease has triggered the growth of preclinical renal imaging to augment better diagnostics and early detection. With the strong correlation between kidney and cardiovascular diseases, the renal blood flow has become a subject of interest for molecular imaging, which plays an important role in biomarker discovery. At Invicro, ex vivo imaging is implemented in kidney studies with the goal of visualizing the renal clearance and 3D structural mapping. Invicro’s multispectral fluorescence imaging techniques have been developed for high throughput and low cost to measure drug distribution. A fluorescence imager with corresponding software package was built as an add-on to currently available cryoslicing instruments. This novel workflow, called cryofluorescence tomography (CFT), is a versatile and transportable form of molecular imaging. In this study, multispectral CFT was performed on a rat kidney to simultaneously visualize the renal clearance of PEG909-ZW800-1 and PEG909-ZW700-1 tracers.
Spectral filtration was used to gather fluorescence images of both tracers simultaneously. White light images were concurrently captured to provide anatomical context. Images were aligned and built into a 3D fluorescence distribution. A correction algorithm was applied to the fluorescence images to mitigate the effect of optical scattering and absorption. Reconstructed images for both tracers are shown in Figure 1 below.
Figure 1
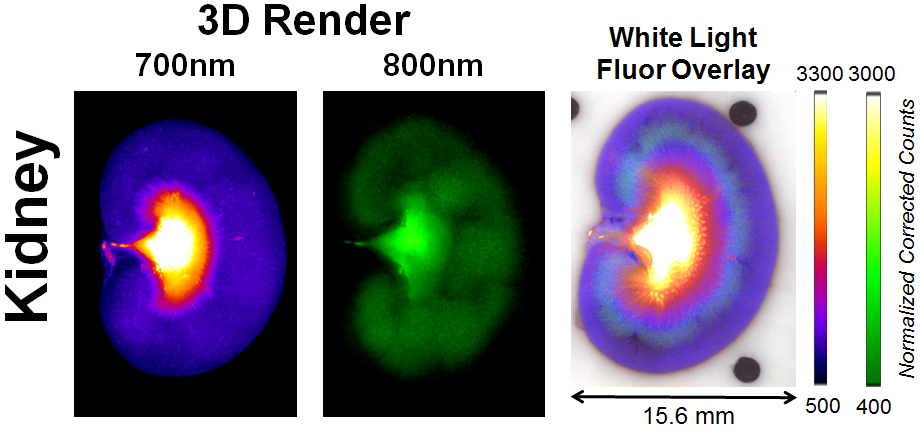
A 3D rendering of the kidney was generated in VivoQuant® using the maximum intensity projection feature, enhancing the visualization of renal fluorescence distribution as well as structural mapping. The 3D distribution of both tracers in the kidney is shown in a maximum intensity projection in Figures 2A and 2B below.
Figure 2
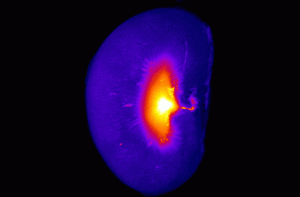
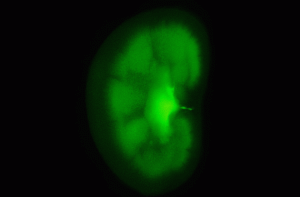
A) The Intravenously injected tracer, B) The Intrathecally injected tracer
A slice-by-slice overlay of the white light and the fluorescence images were also created to better visualize the fluorescence distribution within the kidney. Additionally, the multi-view layout in VivoQuant® was used to generate a slice-by-slice flythrough of the white light and fluorescence images. The fluorescence recovery and white light flythroughs are shown below in Figure 3.
Figure 3
The current workflow is constructed to interface with existing tools, including the assignment of metainformation so that the resulting images can be accessed through the cloud and viewed anywhere in the world. The built-in toolkit not only facilitates data analysis, but it also allows multiple options for data storage and presentation. Cryofluorescence tomography, equipped with Invicro’s developed instruments and software package, has become an innovative and versatile method to provide meaningful, accessible molecular information.