
Lipid quantification is a valuable tool in measuring fatty liver disease. While it is possible to gather quantification information using a biopsy, it is less invasive and more comprehensive to perform quantification for an entire organ using magnetic resonance spectroscopy methods. While MRI signal is largely due to the presence of water molecules, it can also be affected by large concentrations of other molecules. Distinct molecules will in turn have distinct magnetic characteristics, which allow their relative concentrations to be calculated based on temporal signals. Therefore, different types of lipids and molecules of water will precess at different characteristic frequencies. Sampling the signal intensity at different echo times will produce different values depending on the array of species that are present. If a knock-down pulse is used for the water molecules, it becomes easier to isolate and measure the signal due to fat.
Figure 1

A phantom with differing ratios of fat and water is constructed. The top row contains, from left to right, 15% lipid and 20% lipid. The bottom row contains, from left to right, 0%, 5%, and 10% lipid. The remainder is water. Differing echo time readouts result in different signal intensities depending on the relative concentration of water and fat due to differing magnetic properties.
A toolkit was developed at Invicro to calculate the relative concentration of fat and water in biological tissue using MR images. A look up table approach was used to isolate the appropriate spectroscopic parameters, as the precession frequency will change slightly due to thermal effects. A series of MR readout images with varying echo times are fed into the algorithm, which performs a regularized constraint optimization process to recover the relative quantity of fat and water for each voxel based on fitting to established precession equations (Figure 2).
Figure 2
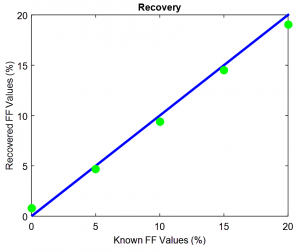
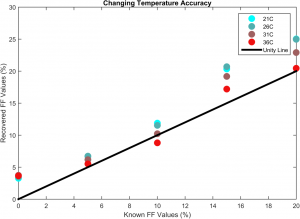
A series of phantom experiments was performed to test the validity of the toolkit. A series of phantoms with differing concentrations of water and intralipid were constructed with relative concentrations of lipid including 0%, 5%, 10%, 15%, and 20%, with the relative concentration of water making up the remainder of each sample (Figure 1). Multi-echo MRI images were gathered and passed through the calculation pipeline. The effects of unknown temperature were investigated by using an array of estimated temperature changes relative to the known phantom temperature of 37 C. The model recovery was shown to be robust for temperature ranges of a few degrees about truth (Figure 3).
Figure 3
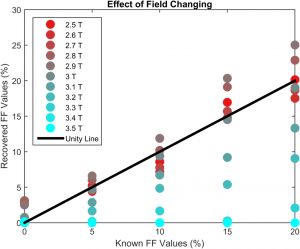
Similarly, since the field strength of the uniform magnetic field was known to be 3T, it is possible to examine the effect of field strength model mismatch. The recovery was shown to be consistent with model mismatch up to about 0.2T of error at 3T (Figure 4).
Figure 4
The toolkit described here was initially written using MATLAB (MathWorks, Inc., Natick, MA). However, due to the resounding success and robustness of the model, it was rewritten as a plugin for VivoQuant®. The VivoQuant® implementation of the code base is both more versatile and more robust. Using the tools developed at Invicro, we were able to develop, implement and test an experimental quantification toolkit. The speed at which the model could be run allowed for batch processing to examine the validity of the model under differing experimental conditions.